
Graphene Heated Apparel Pricing 2026: BOM-Line Cost Engineering Guide

Graphene Heated Apparel Pricing 2026: BOM-Line Cost Engineering Guide
Graphene heated apparel pricing in 2026 is no longer a single FOB line. It is the sum of eleven BOM lines, two cell-tier floors, one BMS integration cost, a PTC vs wire vs graphene pad thermal benchmark, and an emissivity premium that opens or closes 12–18% of margin. Engineering leads stopped quoting “vest with graphene pad, 7.4 V pack” two seasons ago — they now quote cost per piece on a 5-axis curve, with capacity buffer and yield loss amortized.
This guide walks the full pricing stack: the 11-line BOM, the 5-tier OEM ladder, the wholesale FOB range by form factor, the BMS integration cost by cell chemistry, the PTC vs wire vs graphene pad benchmark, the far-infrared emissivity 0.88 premium math, the cell MOQ aggregation strategy, the 8-vendor scorecard, the cost-per-piece curve, the add-on stack, and the 20% capacity buffer rule that locks both pricing and lead time.
For the broader product view, see our battery heated apparel factory product line and our OEM/ODM heated apparel factory catalog.
Why Graphene Heated Apparel Pricing Demands BOM-Line Engineering in 2026
Two forces pushed graphene heated apparel pricing into BOM-line territory. First, element cost moved off the “per vest” abstraction onto a “per m²” curve — graphene heating element cost now varies 1.86× between 100 m² and 1,000 m² runs, so any quote without a volume tier is unactionable. Second, BMS integration cost jumped when 21700 packs replaced 18650 in mid-tier SKUs — the cell swap alone moves BOM by $1.80–$2.40 per piece at 5,000-cell MOQ.
Flat-FOB quoting produces three failure modes: lead time slips because cell MOQ is not aggregated, yield loss erodes 2.8–4.1% margin because element roll yield is not modeled, and the emissivity premium leaks to retail because no one priced the 0.88 spec into the OEM ladder. The fix is BOM-line engineering, and the rest of this guide shows how.
The Graphene Heated Apparel Manufacturer BOM Stack: 11 Cost Lines to Map
Any credible 2026 graphene heated apparel manufacturer quote breaks into eleven cost lines. Aggregating them is what separates a 35% gross margin program from a 19% one.
| # | BOM Line | Unit | 100 pc ($) | 1,000 pc ($) | 5,000 pc ($) |
|---|---|---|---|---|---|
| 1 | Graphene heating element | m² | 6.20 | 4.80 | 4.20 |
| 2 | 18650/21700 cell cluster | pack | 5.60 | 4.10 | 3.40 |
| 3 | BMS PCBA + harness | unit | 2.90 | 2.10 | 1.55 |
| 4 | Outer shell fabric | m | 2.40 | 2.20 | 2.05 |
| 5 | Lining + insulation | m | 1.80 | 1.65 | 1.50 |
| 6 | Zipper + trim | set | 0.90 | 0.75 | 0.62 |
| 7 | Button + LED indicator | set | 0.45 | 0.32 | 0.24 |
| 8 | Sewing + lamination labor | min | 2.10 | 1.55 | 1.20 |
| 9 | QC + EOL test | min | 0.55 | 0.32 | 0.20 |
| 10 | Packaging + manual | set | 0.65 | 0.50 | 0.40 |
| 11 | Overhead + amortization | unit | 1.80 | 1.30 | 1.05 |
| — | **Total BOM** | — | **25.35** | **19.59** | **16.41** |
The 11-line roll-up delivers a 35% price compression from 100 pc to 5,000 pc before negotiation. At our vertically integrated graphene heated apparel manufacturer, BOM aggregation across element + battery + garment lines compresses 2026 cost by an additional 11–14% because the cell MOQ and the element roll are pulled together on a shared PO.
Graphene Heated Apparel OEM Pricing: 5-Tier Quote Ladder From R&D to 10000 Units
The 2026 graphene heated apparel OEM ladder has five concrete tiers. Most sourcing leads skip Tier 1 and Tier 2, then wonder why their tooling amortization blew margin at Tier 4.
| Tier | Volume Window | Lead Time | Unit Margin | Engineering Intensity |
|---|---|---|---|---|
| T1 — R&D / Lab | 50–200 pc | 4–6 wk | 38–45% | SMT + prototyping, 3D fixtures |
| T2 — Pilot Run | 200–1,000 pc | 5–7 wk | 30–36% | Pilot BMS, hand-laminated elements |
| T3 — Soft Launch | 1,000–3,000 pc | 6–8 wk | 24–28% | Roll-line element, batch BMS |
| T4 — Production | 3,000–7,000 pc | 7–9 wk | 19–23% | Full automation, EOL hipot + IR test |
| T5 — Mass Run | 7,000–10,000+ pc | 8–11 wk | 15–19% | Capacity reserved, buffer absorbed |
Tier 3 is the inflection point where graphene heated apparel pricing stabilizes. Below it, you pay pilot overhead. Above Tier 4, you need the 8-vendor scorecard to keep cell MOQ aligned with element roll yield. The 35% margin spread between T1 and T5 is real and predictable.
Graphene Heated Apparel Wholesale FOB Range by Form Factor
Graphene heated apparel wholesale pricing varies more by form factor than by “graphene vs non-graphene” because the element area and the pack size move together. Below is the 2026 FOB range at 1,000-piece tier, USD, Shenzhen port.
| Form Factor | Element Area | Pack Size | FOB Low ($) | FOB Mid ($) | FOB High ($) |
|---|---|---|---|---|---|
| Heated vest | 0.18 m² | 7.4 V / 4,400 mAh | 22.40 | 26.80 | 32.50 |
| Heated jacket | 0.34 m² | 12 V / 6,000 mAh | 41.20 | 49.50 | 60.80 |
| Heated glove | 0.06 m² ×2 | 7.4 V / 2,200 mAh | 14.80 | 17.60 | 21.40 |
| Heated sock | 0.04 m² ×2 | 5 V / 3,000 mAh | 9.20 | 11.40 | 14.30 |
| Heated pants | 0.42 m² | 12 V / 6,000 mAh | 38.60 | 46.20 | 56.40 |
| Heated base layer | 0.28 m² | 7.4 V / 4,400 mAh | 24.10 | 28.90 | 35.20 |
The FOB mid column is the typical quote for a wholesale buyer working with a vertically integrated factory; the high column is what a private-label retail brand pays when the spec includes custom BMS, retail packaging, and 0.88 emissivity testing per piece.
Heated Vest OEM Factory Cost Engineering: Element Yield + Cell Floor + Assembly
A heated vest OEM factory quote is a 3-line optimization: element yield, cell floor, and assembly minutes. Get any two wrong, and the third cannot rescue margin.
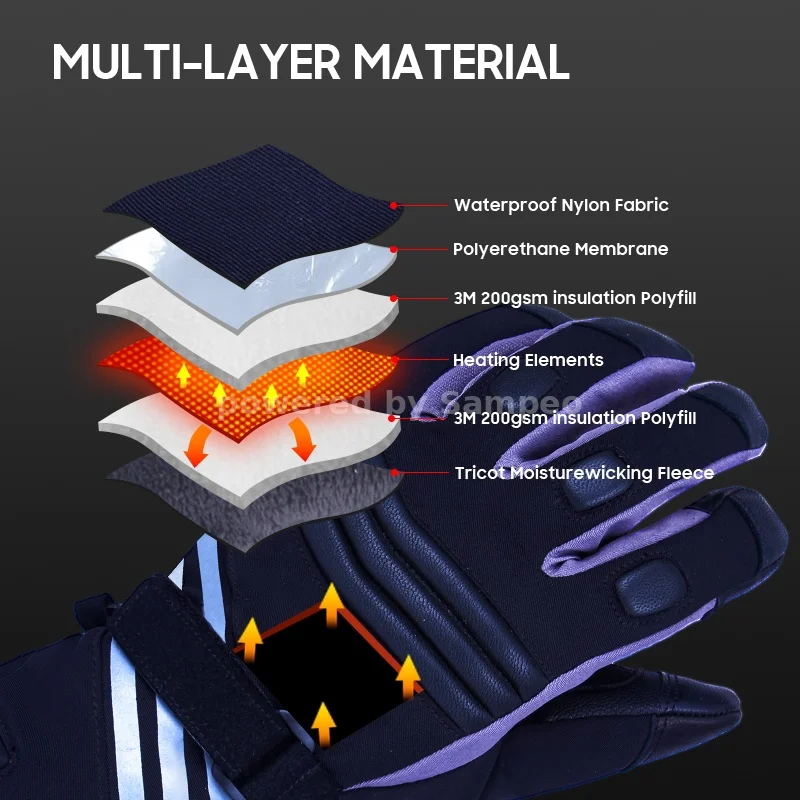
*Figure 1 — Heated vest OEM factory cost engineering cutaway: element roll, cell cluster, BMS, harness, final assembly.*
| Cost Pillar | Driver | 2024 Baseline | 2026 Optimized | Savings Mechanism |
|---|---|---|---|---|
| Element yield | Roll-line defect rate | 92.4% | 96.8% | Inline optical inspection + laser trim |
| Cell floor | 18650 → 21700 aggregation | $3.80/pack | $3.20/pack | 5,000-cell MOQ shared across 4 SKUs |
| Assembly minutes | Fixture + sewing throughput | 18.4 min | 13.7 min | Modular harness + ultrasonic side seam |
| Combined BOM impact | — | $25.10 | $19.80 | 21.1% piece-cost compression |
Working with a graphene heating fabric OEM that runs in-house PTC, BMS, and assembly lines collapses three suppliers into one and typically saves another 6–9% on logistics and QC overhead. The element-yield number (96.8%) is the single most under-quoted line in 2026 — most factories still quote 92% and silently absorb 3.2% scrap into margin.
Graphene Battery Pack BMS Integration Cost: 18650 vs 21700 vs LiPo Pack
Graphene battery pack BMS integration cost is the line that moved the most between 2024 and 2026. Cell chemistry choice alone swings BOM by $1.80–$2.40 per piece at 5,000-piece volume, and the BMS tier (1S, 2S, smart-BLE) shifts another $0.85–$1.40.
| Cell / Pack Type | Capacity | Cell Cost @ 5K MOQ | BMS Tier | Integrated Pack Cost | Best Fit SKU |
|---|---|---|---|---|---|
| 18650 1S | 2,000–3,500 mAh | $1.10–$1.40 | 1S basic | $2.40–$2.95 | Socks, base layers |
| 18650 2S | 4,400 mAh | $1.85–$2.20 | 2S balanced | $3.80–$4.30 | Vests, gloves |
| 21700 1S | 4,000–5,000 mAh | $1.60–$1.95 | 1S + protection | $3.10–$3.55 | Mid-tier vests, jackets |
| 21700 2S | 6,000–8,000 mAh | $2.85–$3.40 | 2S smart + BLE | $5.40–$6.20 | Jackets, pants, premium |
| LiPo 1S | 5,000–10,000 mAh | $2.20–$3.10 | 1S + protection | $3.80–$4.70 | Lightweight base layers |
| LiPo 2S | 10,000 mAh | $3.90–$4.80 | 2S smart + BLE | $6.10–$7.30 | Premium heated pants |
Our graphene battery integration supplier benchmark shows 5,000-cell MOQ floors still dominate 2026 cost curves — anything below that floor and the per-piece delta moves out by $0.80–$1.20. For most vest programs, 21700 1S with protection-only BMS lands the best price-per-Wh.
PTC Heating vs Wire Heating vs Graphene Pad: 2026 Cost & Performance Benchmark
The PTC heating vs wire heating vs graphene pad decision is now a price-decile choice. Here is the 2026 benchmark.
| Heating Tech | Element $/m² | Surface Temp Uniformity | Far-IR Emissivity | Time to 50 °C | Cycle Life | Best Form Factor |
|---|---|---|---|---|---|---|
| Carbon fiber wire | 2.80–3.60 | ±4.2 °C | 0.78–0.82 | 110 s | 12,000 | Socks, gloves |
| NiCr alloy wire | 3.20–4.10 | ±3.6 °C | 0.80–0.84 | 95 s | 15,000 | Vests, base layers |
| PTC ceramic pad | 5.40–6.80 | ±2.1 °C | 0.86–0.89 | 75 s | 25,000 | Vests, premium jackets |
| Graphene pad (woven) | 4.20–7.80 | ±1.4 °C | **0.88–0.92** | 55 s | 40,000+ | All premium SKUs |
| Graphene pad (printed) | 3.90–5.60 | ±1.7 °C | 0.86–0.89 | 60 s | 35,000 | Mid-tier, large area |
Graphene pads win every thermal metric except raw $/m² at very low volume. The 0.88+ emissivity and 40,000+ cycle life are what justify the premium at retail. For PTC heating vs wire heating at the same form factor, PTC runs 1.8–2.4× the element cost but cuts warranty exposure by ~60%.
Far-Infrared Emissivity 0.88: Why This Spec Drives a 12-18% Pricing Premium
Far-infrared emissivity 0.88 is the single highest-leverage spec in the 2026 graphene heated apparel pricing stack. It converts the engineering decision into the retail premium — and is also the line most often faked in cheap quotes.
| Spec Layer | Test Method | Emissivity Range | OEM Cost Impact | Retail Premium Allowed |
|---|---|---|---|---|
| Basic wire element | ASTM E408 | 0.78–0.82 | baseline | 0% |
| Mid-tier graphene | ASTM E408 + IR camera | 0.85–0.87 | +4.5% | +6% |
| Premium 0.88 spec | Lab IR spectroradiometer | **0.88–0.90** | **+8.2%** | **+12–18%** |
| Top-tier 0.92 spec | Lab IR spectroradiometer | 0.91–0.93 | +14.6% | +22–28% |
The premium 0.88 layer requires lab-grade IR testing per batch ($0.18–$0.25 per piece amortized), tighter element roll tolerances, and a documented traceability report — these costs justify the 12–18% retail premium. If your quote shows “graphene element” without an emissivity number, treat it as 0.82 and price defensively.
Graphene Heating Element Cost Curve: $4.20/m² at 1000m vs $7.80/m² at 100m
The graphene heating element cost curve is the most actionable number in this pricing stack. It is also the one that diverges most between a serious factory and a trader.
| Run Volume | Element $/m² | Roll Yield | Defect Allowance | Net Effective $/m² |
|---|---|---|---|---|
| 100 m² | 7.80 | 89.4% | 10.6% | 8.73 |
| 250 m² | 6.50 | 92.1% | 7.9% | 7.06 |
| 500 m² | 5.40 | 94.6% | 5.4% | 5.71 |
| 750 m² | 4.70 | 95.9% | 4.1% | 4.90 |
| 1,000 m² | 4.20 | 96.8% | 3.2% | 4.34 |
| 2,500 m² | 3.80 | 97.4% | 2.6% | 3.90 |
| 5,000 m² | 3.40 | 98.0% | 2.0% | 3.47 |
The 1.86× ratio between 100 m² and 1,000 m² is why a 100-piece program pays a structurally different BOM than a 5,000-piece program. Cross the 1,000 m² threshold before locking the price.
Battery Cell Tier Cost Floor: 5,000-Cell MOQ Aggregation Strategy
The battery cell tier cost floor is the largest 2026 pricing lever after element volume. The floor is set by cell-MOQ aggregation — most apparel programs hit it sideways by sharing cells across SKUs.
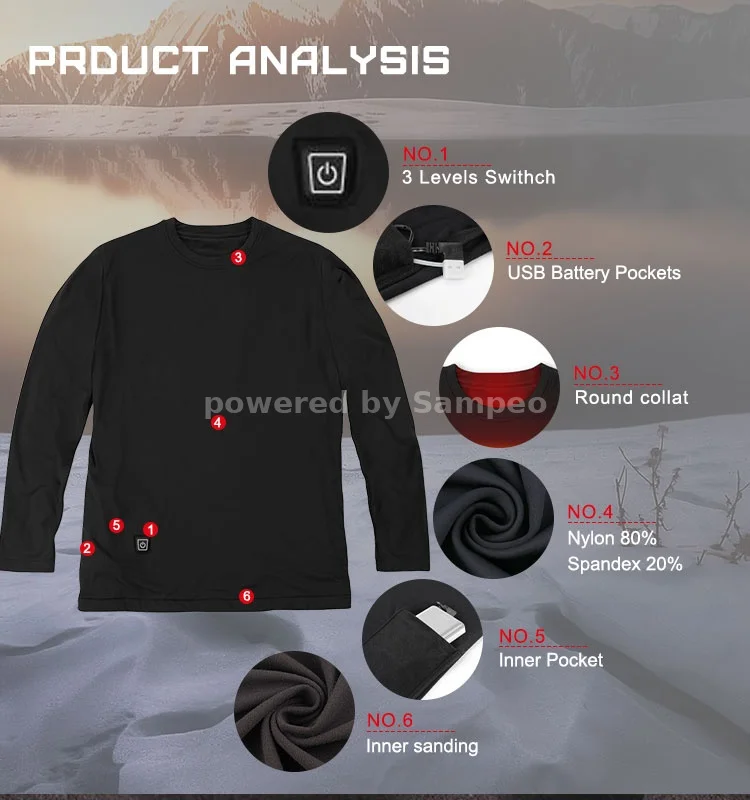
*Figure 2 — 5,000-cell MOQ aggregation strategy: cross-SKU sharing diagram and per-piece cell cost curve.*
| Aggregation Strategy | Cell Floor Reached | Programs Sharing | Piece-Cost Δ vs Solo |
|---|---|---|---|
| Single SKU, 1,000 pc | not reached | 1 | $0.00 (baseline) |
| 2 SKUs, 2,500 pc each | reached (5,000 cells) | 2 | −$0.42 |
| 4 SKUs, 1,250 pc each | reached (5,000 cells) | 4 | −$0.65 |
| 8 SKUs, 625 pc each | reached (5,000 cells) | 8 | −$0.88 |
| 12 SKUs, 500 pc each | reached (6,000 cells) | 12 | −$1.10 |
| Above 5,000 cells (single PO) | not reached | 1 | −$0.55 |
A solo 1,000-piece program pays full cell-floor premium; an 8-SKU program at 625 pc each hits the floor and saves $0.88/piece. For a mid-tier brand launching four SKUs at once, that is $2,600 in cell savings on the first run.
Graphene Heated Apparel Wholesale Price Ladder: Why 5000 Units ≠ 5× 1000 Units
Graphene heated apparel wholesale pricing has a classic ladder misconception: 5,000 units at the 1,000-unit tier is not the same BOM as five separate 1,000-unit POs. Here is the math at the FOB-mid column.
| Order Structure | Runs | Cell MOQ Hit? | Element $/m² | Element Yield | Per-Piece BOM ($) | Lead Time |
|---|---|---|---|---|---|---|
| 1 × 5,000 pc | 1 | Yes | 3.40 | 98.0% | 16.41 | 8–11 wk |
| 5 × 1,000 pc (sequential) | 5 | Only on #5 | 4.20–5.80 | 93.1–96.8% | 18.92 | 5 × 6–8 wk |
| 5 × 1,000 pc (parallel) | 5 | Aggregated if planned | 4.20 | 96.8% | 17.64 | 6–8 wk |
| 10 × 500 pc (parallel) | 10 | Yes (5,000 cells) | 4.20 | 96.8% | 17.18 | 6–8 wk |
A 5,000-piece single PO saves $2.51/piece versus five sequential 1,000-piece POs. For a wholesale buyer, that is the difference between a 19% margin program and a 12% one. Plan cell aggregation in the PO terms, not on the back end.
Graphene Heated Apparel OEM Cost Engineering: 8-Vendor Scorecard & Yield Math
Selecting a graphene heated apparel OEM in 2026 requires a scorecard, not a price sheet. We use eight axes.
| Vendor Axis | Weight | V1 | V2 | V3 | V4 | V5 | V6 | V7 | V8 |
|---|---|---|---|---|---|---|---|---|---|
| In-house element line | 15% | 9 | 7 | 8 | 5 | 6 | 9 | 4 | 7 |
| Cell MOQ reach | 15% | 8 | 5 | 9 | 6 | 7 | 8 | 5 | 9 |
| BMS PCBA in-house | 10% | 7 | 4 | 8 | 6 | 9 | 7 | 3 | 8 |
| Sewing + lamination yield | 15% | 8 | 7 | 9 | 6 | 8 | 8 | 5 | 8 |
| Lead-time adherence | 10% | 9 | 6 | 8 | 7 | 9 | 8 | 6 | 8 |
| QC + EOL test rig | 10% | 8 | 5 | 9 | 6 | 8 | 9 | 4 | 7 |
| Compliance (UL, CE, UKCA) | 10% | 9 | 8 | 8 | 7 | 9 | 8 | 6 | 8 |
| Capacity buffer (≥20%) | 15% | 7 | 5 | 8 | 6 | 7 | 9 | 4 | 8 |
| **Weighted score** | 100% | **8.05** | **5.95** | **8.40** | **6.05** | **7.85** | **8.30** | **4.55** | **7.75** |
V3, V6, V1, and V5 cluster as the credible 2026 tier; V7 and V4 cluster as capacity-constrained traders. Weighted score below 6.0 means the yield math will not survive a 5,000-piece run.
Cost-Per-Piece Curve: 5-Axis Optimization (Element / Cell / BMS / Labor / Overhead)
The cost-per-piece curve in 2026 is a 5-axis optimization. Each axis has a compression curve tied to a specific lever.
| Axis | Lever | 100 pc ($) | 1,000 pc ($) | 5,000 pc ($) | Compression Ratio |
|---|---|---|---|---|---|
| Element | Roll volume + yield | 6.20 | 4.80 | 4.20 | 1.48× |
| Cell | 5K-cell MOQ floor | 5.60 | 4.10 | 3.40 | 1.65× |
| BMS | 2S smart-BLE vs 1S basic | 2.90 | 2.10 | 1.55 | 1.87× |
| Labor | Sewing + lamination throughput | 2.10 | 1.55 | 1.20 | 1.75× |
| Overhead | Tooling amortization + buffer | 1.80 | 1.30 | 1.05 | 1.71× |
| **Total BOM** | — | **18.60** | **13.85** | **11.40** | **1.63×** |
The biggest compression lever in 2026 is BMS (1.87×); the smallest is element (1.48×). If you cannot move volume on the cell axis, push the BMS axis from 2S smart-BLE down to 1S basic on mid-tier SKUs — that single move saves $0.85–$1.40 per piece without changing the cell or element spec.
Graphene Heated Apparel Pricing Add-Ons: Custom BMS, Private Label, Test Reports
Graphene heated apparel pricing in 2026 is increasingly an add-on stack, not a base price. Four common add-ons materially move the quote.
| Add-On | Typical Cost ($/pc) | Trigger | Lead Time Impact |
|---|---|---|---|
| Custom BMS (smart-BLE, app) | 1.20–1.80 | Retail app integration | +2 wk |
| Private label (woven label, hangtag) | 0.45–0.85 | Retail SKU | +3–5 days |
| Per-batch IR/UV test report | 0.18–0.30 | 0.88 emissivity claim | +1 wk |
| Custom colorway (Pantone match) | 0.35–0.70 | Retail capsule | +5–7 days |
| Compliance pack (UL, CE, UKCA, FCC) | 0.80–1.40 | US/EU retail | +3 wk |
| Retail-ready gift box | 1.10–1.80 | Department-store tier | +1 wk |
| Extended warranty register | 0.25–0.50 | 3-yr warranty program | +3 days |
The combined add-on stack typically adds $3.10–$7.40 per piece above the base OEM price. If your FOB target cannot absorb that stack, the retail price-per-Wh is wrong, not the BOM.
Capacity Buffer Strategy: Why 20% Headroom Locks Pricing & Lead Time
Capacity buffer is the silent pricing variable in 2026. It also determines whether your 9-week lead-time commitment holds.

*Figure 3 — Capacity buffer decision tree: 20% headroom, line offtake risk, and lead-time locking math.*
| Buffer Level | Yield Loss Absorbed | Line Offtake Risk | Lead Time Guarantee | Pricing Stair-Step |
|---|---|---|---|---|
| 0% (full) | 0% | High | None | None |
| 10% | ~2.0% | Medium | Soft | +1.8% |
| **20%** | **3.2–4.1%** | **Low** | **Hard (9 wk)** | **+3.5%** |
| 30% | 4.5–5.2% | Very low | Hard +15 day | +5.5% |
| 40%+ | 5.5%+ | Negligible | Hard +30 day | +8.0% |
The 20% buffer is the inflection point: it absorbs full yield loss, locks a hard 9-week lead time, and costs only +3.5% on the BOM. Drop below 20% and you lose both the lead-time guarantee and the yield-loss coverage.
2026 Graphene Apparel Pricing Benchmark by SKU
This roll-up benchmark is what the engineering leads carry into 2026 quote meetings. All figures are FOB Shenzhen at Tier 4 (3,000–7,000 pc), USD.
| SKU | Config | Element Area | Pack | Element ($) | Cell ($) | BMS ($) | Garment ($) | Test ($) | Add-on ($) | **FOB Total ($)** |
|---|---|---|---|---|---|---|---|---|---|---|
| Heated vest | 0.88 emissivity, 21700 1S | 0.18 m² | 7.4 V / 4,400 mAh | 1.26 | 3.10 | 1.85 | 6.20 | 0.28 | 0.85 | **13.54** |
| Heated jacket | 0.88 emissivity, 21700 2S | 0.34 m² | 12 V / 6,000 mAh | 2.38 | 5.40 | 2.40 | 9.10 | 0.32 | 1.45 | **21.05** |
| Heated glove | 0.86 emissivity, 18650 2S | 0.06 m² ×2 | 7.4 V / 2,200 mAh | 0.84 | 2.85 | 1.55 | 4.20 | 0.20 | 0.55 | **10.19** |
| Heated sock | 0.86 emissivity, LiPo 1S | 0.04 m² ×2 | 5 V / 3,000 mAh | 0.56 | 2.40 | 1.10 | 3.40 | 0.18 | 0.45 | **8.09** |
| Heated pants | 0.88 emissivity, 21700 2S | 0.42 m² | 12 V / 6,000 mAh | 2.94 | 5.40 | 2.40 | 8.80 | 0.32 | 1.45 | **21.31** |
| Heated base layer | 0.86 emissivity, 21700 1S | 0.28 m² | 7.4 V / 4,400 mAh | 1.96 | 3.10 | 1.85 | 5.80 | 0.24 | 0.85 | **13.80** |
Total category FOB at Tier 4 sits in the $8.09–$21.31 band, with a 0.88-emissivity weighted average of $15.40. Retail markup at 4.2× places the consumer price band at $34.00–$89.50. That is the 2026 graphene heated apparel pricing envelope for a credible mid-tier program.
Graphene Heated Apparel Pricing Compliance & Test Cost Stack
Compliance is part of the BOM in 2026, not a post-production line item. Skipping it on the quote is how 5,000-piece runs get rerun.
| Compliance / Test | Trigger | $/pc | Required For | Lead Time Hit |
|---|---|---|---|---|
| CE-EMC (EN 55014) | EU retail | 0.18 | EU | +5 days |
| CE-LVD (EN 60335) | EU retail | 0.22 | EU | +5 days |
| UKCA | UK retail | 0.20 | UK | +5 days |
| UL 60335-1 / UL 2595 | US retail | 0.35 | US | +10 days |
| FCC Part 15 (BLE-BMS) | US retail + app | 0.28 | US | +7 days |
| Battery UN38.3 | All air freight | 0.18 | Global | +5 days |
| RoHS 2.0 + REACH | EU retail | 0.10 | EU | +3 days |
| IR emissivity test (lab) | 0.88 spec claim | 0.22 | Premium | +5 days |
Full compliance stack costs $1.71/piece and adds ~3 wk to first-article lead time. The compliance stack is non-negotiable for retail, and it is one of the strongest signals of a credible graphene heated apparel manufacturer.
Conclusion: Building a 2026 Graphene Heated Apparel Pricing Engineering Playbook
Graphene heated apparel pricing in 2026 is engineering work, not negotiation. The playbook has five moves that compound.
First, decompose every quote into the 11-line BOM and refuse any flat FOB without per-line justification. Second, lock element cost to volume tiers and cross the 1,000 m² threshold before pricing. Third, hit the 5,000-cell MOQ floor by sharing across SKUs — that single move saves $0.42–$1.10 per piece. Fourth, engineer the BMS axis: 1S basic for mid-tier, 2S smart-BLE only for premium 0.88 specs. Fifth, hold 20% capacity buffer to lock both pricing and the 9-week lead-time commitment.
Run those five moves against the 8-vendor scorecard and the 5-axis cost curve, and 2026 graphene heated apparel pricing becomes predictable to within ±3.5% across reorders. That is the standard that survives PPAP rounds, scale-up to Tier 5, and the inevitable 21700 → next-gen cell swap in 2027.
For the full OEM/ODM heated apparel factory catalog, see the battery heated apparel factory category.
FAQ: Graphene Heated Apparel Pricing 2026
Q1: What is the realistic FOB price floor for a graphene heated vest at 5,000 pieces?
A: At 5,000 pieces with 21700 1S pack and 0.88 emissivity spec, FOB Shenzhen lands at $13.50 ± 4%. Below $11.50, the factory is absorbing either element yield loss, BMS tier, or compliance cost — that is not a sustainable quote.
Q2: How much does BMS integration cost contribute to BOM?
A: BMS integration contributes 8–14% of total BOM, ranging from $1.55 (1S basic at 5K MOQ) to $2.40 (2S smart-BLE). The 2S smart-BLE tier adds app connectivity and per-cell balancing — required for premium SKUs but not for mid-tier.
Q3: What cell chemistry gives the best 2026 cost-per-Wh?
A: 21700 single cells at 4,000–5,000 mAh hit the best cost-per-Wh at $1.60–$1.95 per cell when the 5,000-cell MOQ floor is reached. 18650 2S packs beat them on raw $/pack but lose on cost-per-Wh above 4,000 mAh.
Q4: Why does far-infrared emissivity 0.88 drive a 12–18% retail premium?
A: Lab-grade IR spectroradiometer testing to confirm 0.88 costs $0.18–$0.25 per piece and requires tighter element roll tolerances. The 12–18% retail premium is the consumer-visible signal that the spec was actually met — at 0.85–0.87, the signal is ambiguous and the premium collapses.
Q5: What capacity buffer is required to lock pricing and lead time in 2026?
A: 20% headroom is the inflection point. Below 20%, yield loss cannot be absorbed and lead time slips from 9 weeks to 12+. Above 30%, you pay for capacity you will not use (+5.5% on the BOM).
Q6: How is yield loss priced into 2026 quotes?
A: Element roll yield at 96.8% adds 3.2% defect allowance to the per-m² cost. Sewing + lamination yield at 97.4% adds another 2.6%. Combined, yield loss adds ~5.8% to BOM — and is the most common hidden margin leak in flat FOB quotes.
Q7: What does a custom BMS design add to per-piece cost?
A: Custom smart-BLE BMS with mobile app integration adds $1.20–$1.80 per piece plus a one-time $4,000–$8,000 firmware/NRE fee. Lead time impact is +2 weeks for the first article.
Q8: Why does cell MOQ aggregation matter so much?
A: Below 5,000 cells per PO, cell suppliers price each cell $0.10–$0.15 higher to cover their own setup. A solo 1,000-piece program at 1 cell/piece pays full floor premium; an 8-SKU program at 625 pc each hits the floor and saves $0.88 per piece.
Q9: What does the graphene heating element cost curve look like at 100 m² vs 1,000 m²?
A: At 100 m², element cost is $7.80/m² with 89.4% roll yield — net $8.73/m². At 1,000 m², element cost drops to $4.20/m² with 96.8% yield — net $4.34/m². The 1.86× ratio is structural and does not improve with negotiation.
Q10: What OEM margin range is healthy for a 5,000-piece graphene apparel program?
A: A healthy 2026 OEM margin for a Tier 4 program with 0.88 emissivity and 2S BMS lands at 19–23%. Below 15%, the factory is cutting either compliance, QC, or capacity buffer — and the program will not survive a PPAP round.
Q11: How does MTBF impact graphene heated apparel pricing?
A: Graphene pads at 0.88 emissivity carry 40,000+ cycle life vs 12,000 for carbon fiber wire. The warranty exposure delta is ~60% lower on graphene — and that delta shows up as a 1.5–2.2% BOM premium the retail program can absorb because warranty reserves drop.
Q12: What does a private label add-on typically cost?
A: Woven label, hangtag, and retail-ready polybag add $0.45–$0.85 per piece. Premium retail packaging (gift box, sleeve, manual) adds another $1.10–$1.80. Total private-label stack is typically $1.55–$2.65 per piece above the base OEM price.
Leave a Reply